10-Year-3-Month Treasury Yield Curve Over the Last 40 Years
Effectiveness of the 10 Year-3 Month Yield Curve as a Recession Indicator
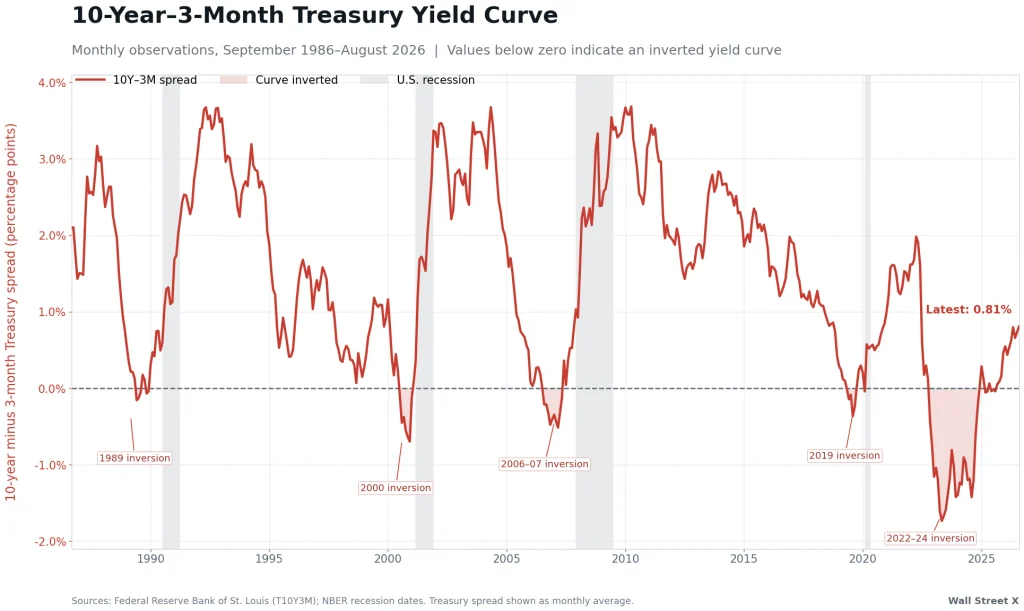
The spread between the 10-year and the 3-month Treasury yield has historically been one of the most closely watched indicators of an approaching U.S. recession. An inverted yield curve occurs when the 3-month Treasury yield rises above the 10-year yield, causing the spread to fall below zero. These areas are indicated by the red shading in chart above. There is a statistically significant relationship between this spread and the probability of recession shortly after, which makes it an extremely effective predictor of recessions.
As the chart illustrates, yield-curve inversions preceded each of the four U.S. recessions recorded by the National Bureau of Economic Research (NBER) since 1986. The curve inverted around 1989 before the recession beginning in July 1990, around 2000 before the March 2001 recession, and during 2006–07 before the Great Recession began in December 2007.
The 2019 inversion was also followed by the recession caused by COVID-19. While the 10-3 yield curve could not predict the pandemic, it did serve to highlight pessimism in the broader economy that made the market more susceptible to economic shocks like COVID-19; resulting in the 10-3 indicator still remaining effective during this outlier event.
Cause For Concern
Most recently, there is cause for concern as the yield curve has recently experienced the deepest and most prolonged inversion it’s seen in the past 40 years. This most recent inversion occurred from 2022–2024 before returning positive. As indicated in the chart, we don’t typically see recessions while the yield curve is inverted – rather, we typically see them shortly after the yield curve flips positive again.
The recent flip happened in early 2025. Based on the past 40 years, the following recession typically happens 1-2 quarters after the return back to positive. Based on this measure, the United States should have seen a recession in late 2025. However, while some facets of the economy did experience contraction, strong economic growth and heavy tech sector spending provided enough cushion to avoid a recession and keep markets stable.
That said, there are fears that the growth has simply delayed the possibility of a recession and that today’s high oil prices may put enough downward pressure to initiate one.
The Case For Optimism
While historically the 10-3 indicator has been incredibly accurate, there are some key factors today that may keep the US out of a recession. These factors are productivity gains from AI investment and strong consumer spending.
While the extent of productivity gain from AI is up for debate – the fact remains that however small, any measured gain in productivity can significantly improve economic output and also improve important economic indicators like job creation. This, coupled with increasing consumer income and spending seem to keeping the economy and broader market stable despite increasing pressure from high oil prices and relatively high inflation.
Key Takeaway
While the historical accuracy of the 10-3 yield curve has been reliable, there are factors that exist today that do seem to be holding off the possibility of a recession despite seemingly increasing downward pressures (high oil prices, high inflation). Thus, the 10-3 yield-curve inversion should be considered a signal of elevated recession risk rather than a guaranteed recession indicator.